Home |
Climate Change Project |
Table of Contents |
Courses | Search |
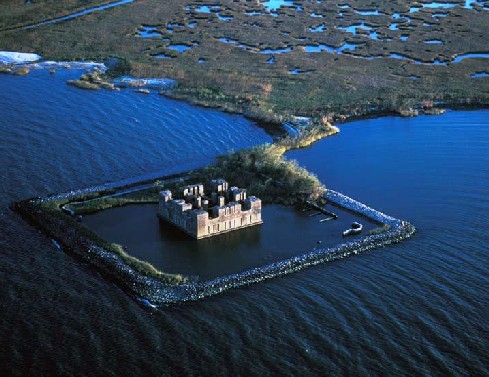
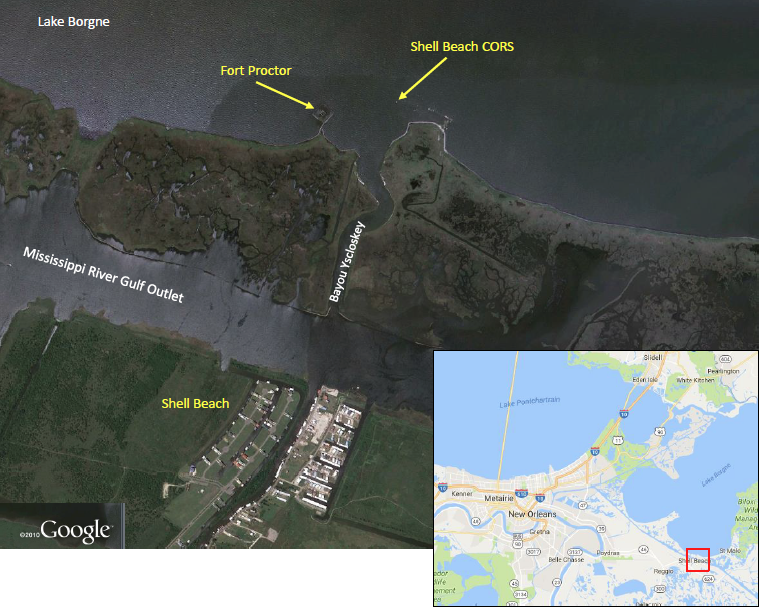
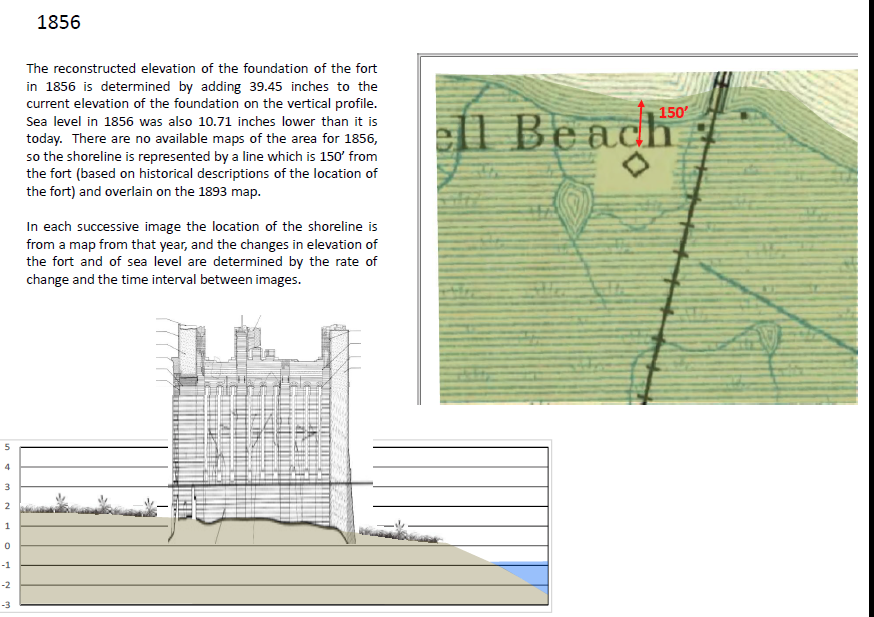
Fort Proctor is a pre-civil war military installation on the shore of Lake Borgne southeast of New Orleans. Historical records state that the fort was constructed 150 feet inland from the shore of the lake just north of the mouth of Bayou Yscloskey. This was also the site of Proctorville, a rail depot at the terminus of the Shell Beach Branch of the New Orleans and Gulf Railroad, which ran along the east bank of the Mississippi River to the town of Poydras, then down the natural levees of Bayou Terre aux Boeufs, Bayou La Loutre and Bayou Yscloskey to the shore of Lake Borgne.
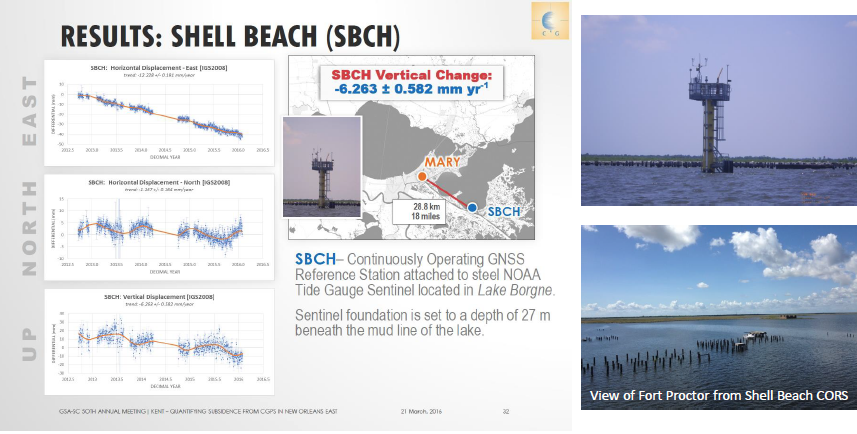
While it can logically be assumed that the original elevations of the fort and the railroad depot were necessarily at least a few feet above sea level, neither of the architectural studies of the fort conducted by Tulane or Louisiana State Universities appear to include any definitive values for the land elevation at the time of construction. The fort is about 1,000 feet from the Shell Beach Continuously Operating Reference Station (CORS) of the National Geodetic Survey. This station is a part of the Global Navigational Satellite System that provides data for the three-dimensional Global Positioning System (GPS) network. In addition to surface positioning data this station provides a measurement of the vertical movement of the earth’s surface, which in this case can be used to estimate a rate of subsidence.
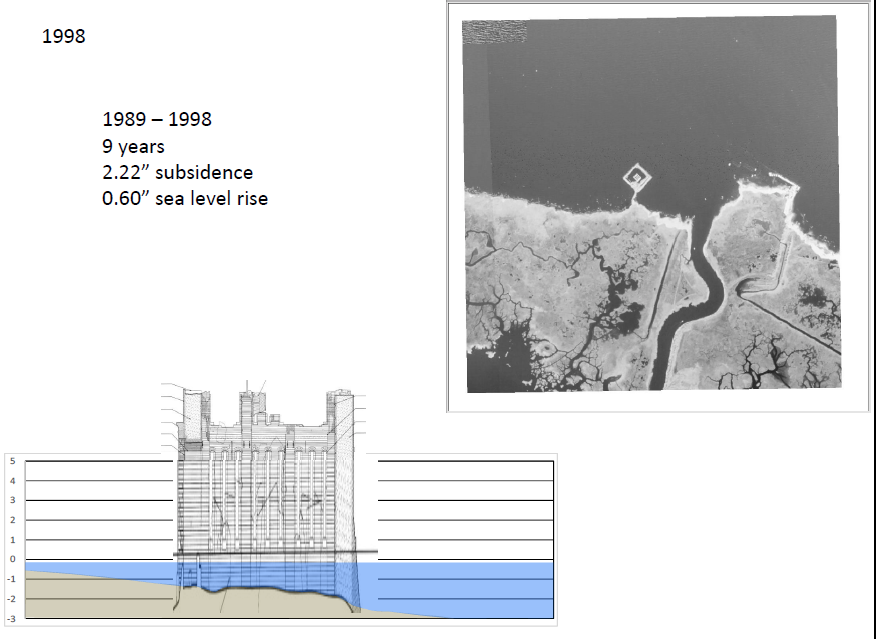
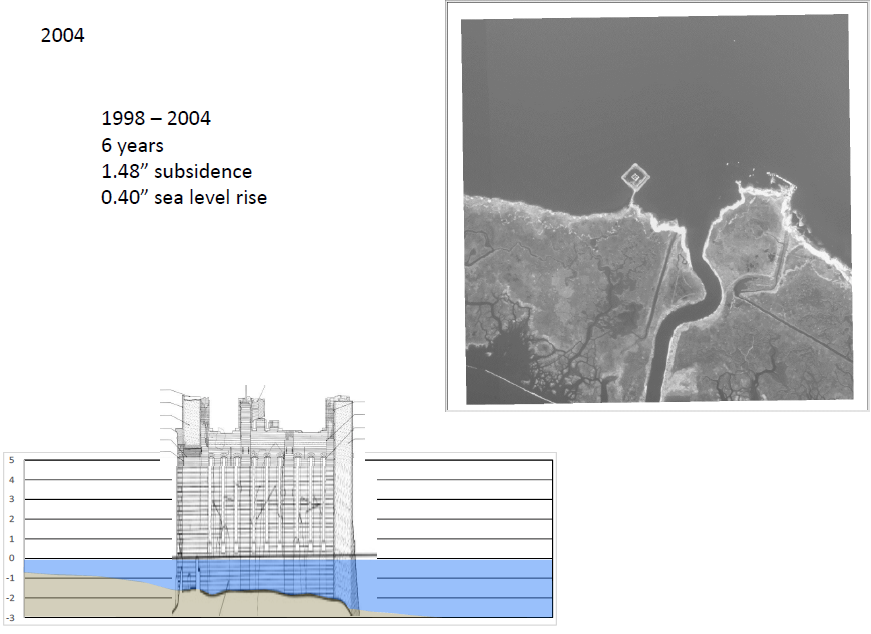
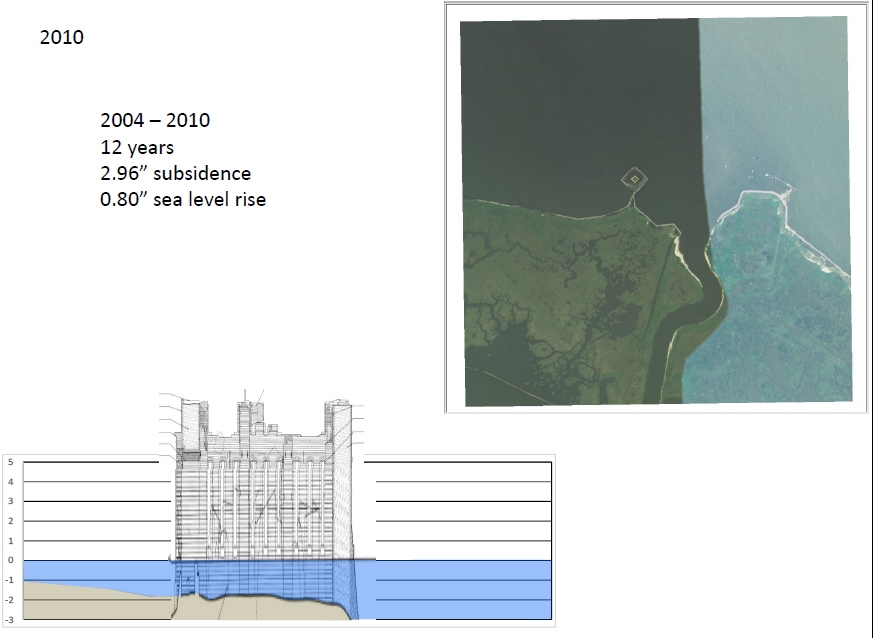
Evaluation of data from the Shell Beach CORS by the LSU Center for GeoInformatics indicates a current rate of subsidence at this location of about 6.263 millimeters per year (mm/yr) or about 2.5 inches per decade. The premise of the illustrations of the impacts of subsidence over time that follow is that this subsidence rate can be used to estimate the elevation of Fort Proctor at various points of time in the past relative to its current elevation. This relative approximation is made without knowledge of the absolute value of the elevation at any time. If data for the elevation of the fort at some point of time in the past were known, it could be used to calibrate the estimated relative rates of change based on current subsidence data.
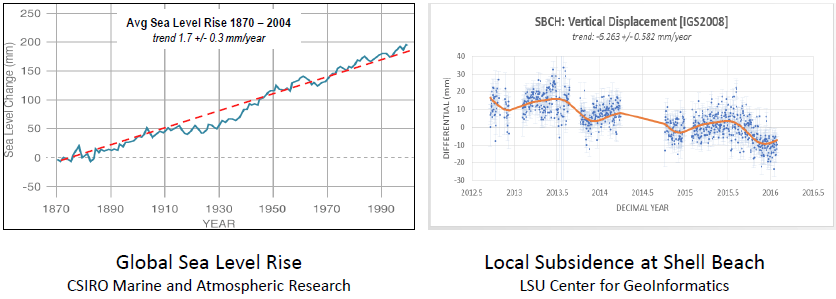
For the purposes of constructing the illustrations that follow the rate of global sea level rise and the rate of local subsidence at Fort Proctor are assumed to be constant for the time period from 1856, when the fort was constructed, to the present. A constant subsidence rate of 6.23 mm/yr for this 160 time span results in a total elevation change at the site of the fort of 39.45 inches. A constant rate of sea level rise of 1.7 mm/yr results in a change in global sea level of 10.71 inches during the same time period. This means that in 1856 the elevation of the foundation of the fort was about three and a half feet higher than it is today and sea level was almost a foot lower than it is today. The total combined “relative sea level rise” experienced at the site of Fort Proctor between 1856 and the present has been 50.16 inches based on the extrapolation of these data.
In other words the site of Fort Proctor was over four feet higher than it is today relative to sea level at the time of construction. For the purposes of constructing illustrations of the relative changes of land elevation and sea level over time the elevation of the “high tide” line on the architectural drawings of the fort that follow is assumed to be current sea level. This assumption is certainly not accurate, but it allows for tying relative changes in elevation to a scaled vertical elevation profile of the fort, and it is not intended to represent an actual elevation.
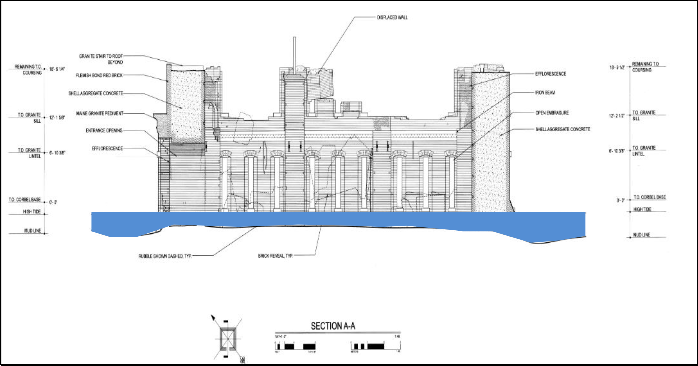
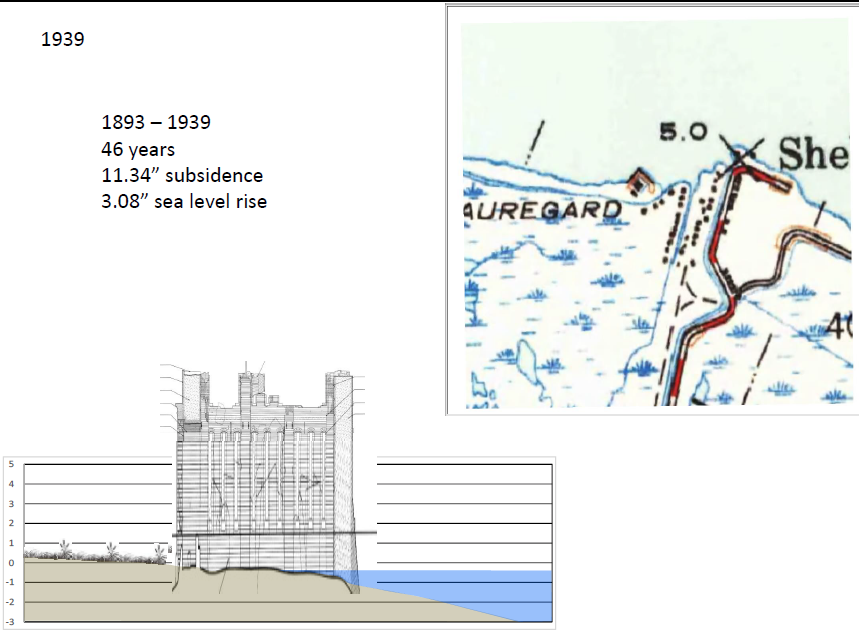
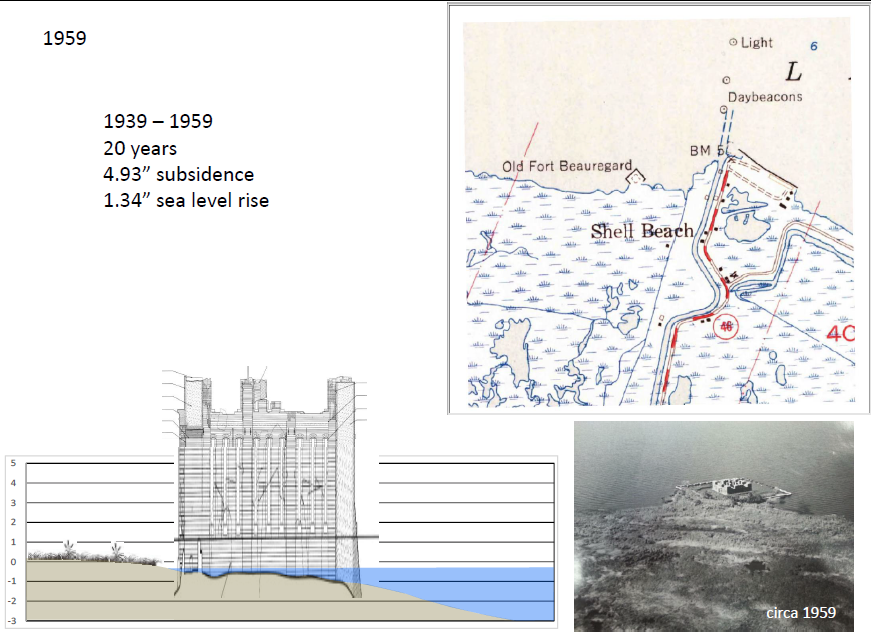
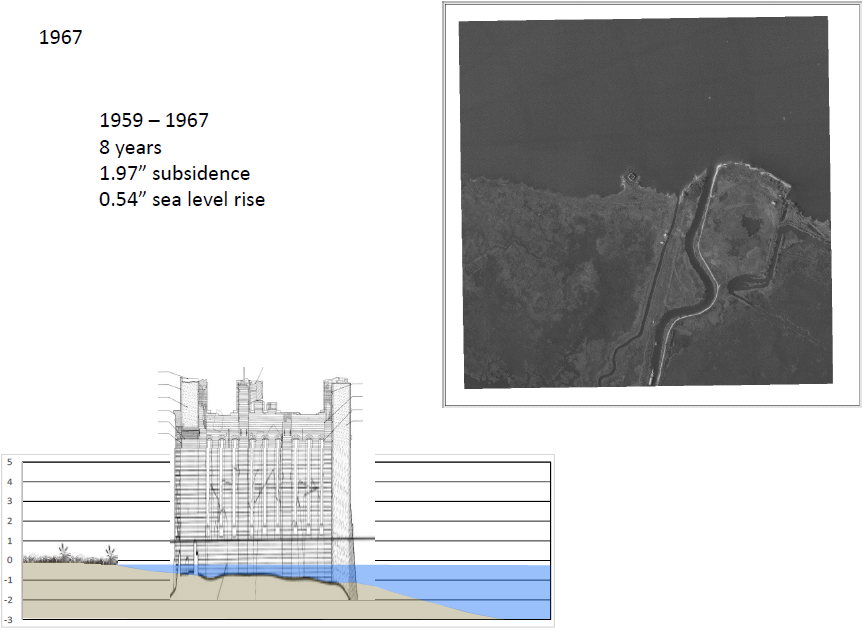
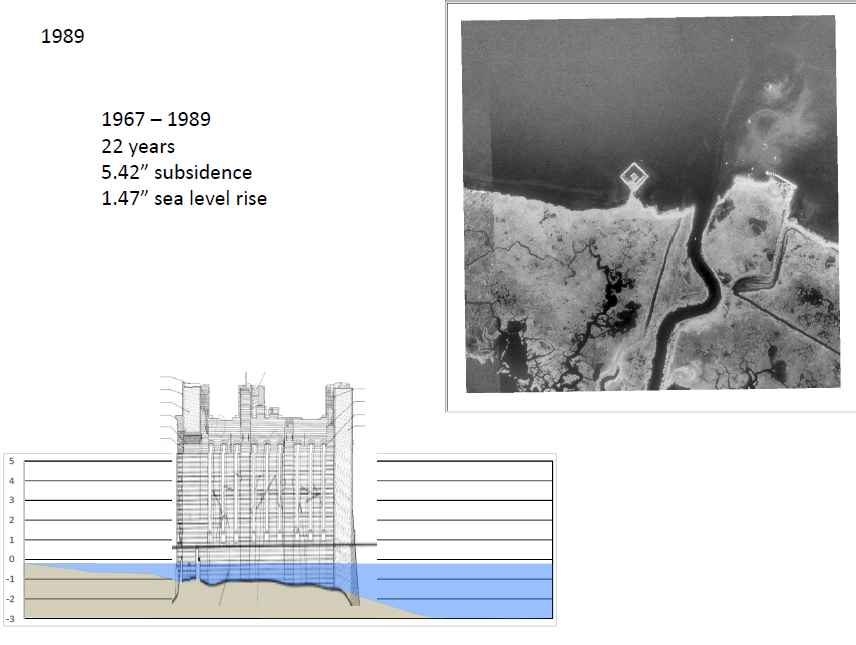
An elevation profile of the fort taken from a Historic American Building Survey published in “Fort Proctor: A Conditional Preservation” by Ursula Emery McClure and Bradley Cantrell in 2013 is used as the basis for this illustration. The profile has a proportional vertical scale and a reference for the elevation of “high tide”, but it is not otherwise referenced to a defined benchmark elevation. For the purposes of illustrating the relative effects of subsidence and sea level rise the high tide level is taken to be current sea level.
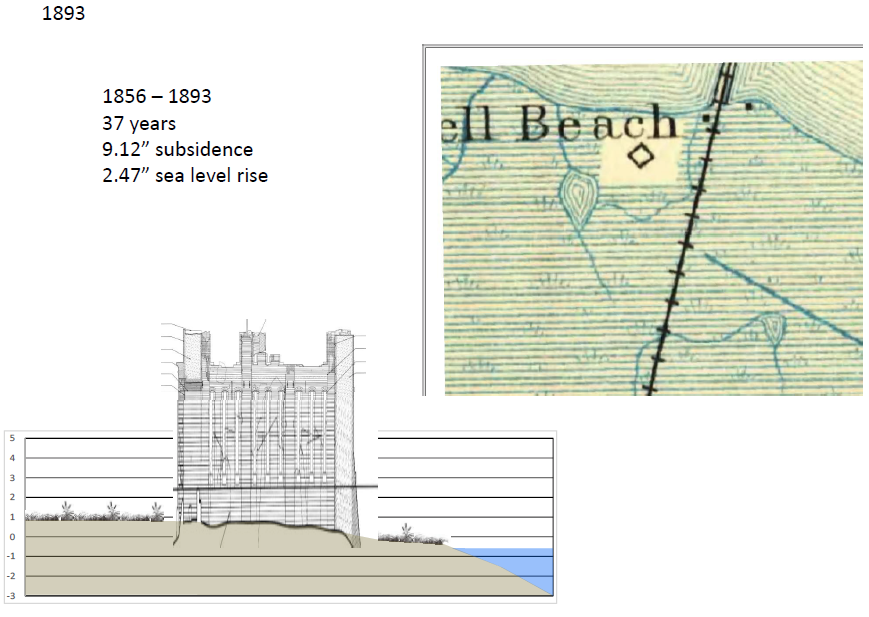
The illustrations that follow are constructed as a time sequence of profiles based on applying fixed rates of subsidence and sea level rise for the time period from the construction of the fort in 1856 to the present. A rate of 1.7 mm/yr is used for sea level rise based on the IPCC estimate for the average rate between 1870 and 2004. A rate of 6.23 mm/yr is used for subsidence based on the current value derived by The LSU Center for GeoInformatics from the Shell Beach CORS facility, which is about 1,000 feet from Fort Proctor. Using these rates and time interval the total change in elevation due to subsidence is 39.45 inches and the total change in the elevation of sea level is 10.71 inches. The sequence begins with the elevation of the foundation of the fort 39.45 inches higher in 1856 than it is on the present day profile. Likewise, the elevation of sea level is 10.71 inches lower on the 1856 profile than it is on the present day profile. The elevation of foundation of the fort and sea level change on each profile in the sequence based on the time interval between profiles.
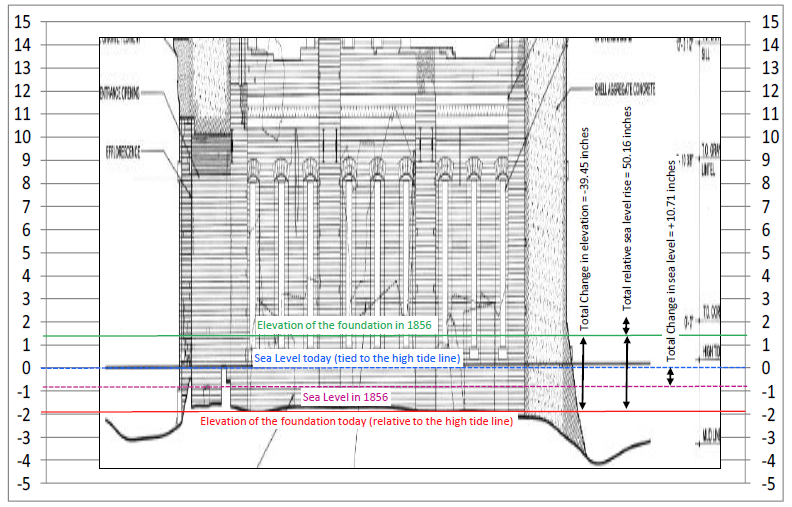
The elevation profile of Fort Proctor is vertically exaggerated and tied to a vertical scale. The elevation of the “high tide” line from the profile is tied to the zero elevation line on the vertical scale indicating current sea level. The initial reconstructed elevation of the foundation of the fort is determined by adding the calculated value of subsidence from 1856 to the present (39.35”) to the elevation of the foundation on the current profile. The initial reconstructed elevation of sea level is determined by subtracting the calculated value of sea level rise from 1856 to the present (10.71”) from the current sea level on the profile
1 Dec 2016
The Climate Change and Public Health Law Site
The Best on the WWW Since 1995!
Copyright as to non-public domain materials
See DR-KATE.COM for home hurricane and disaster preparation
See WWW.EPR-ART.COM for photography of southern Louisiana and Hurricane Katrina
Professor Edward P. Richards, III, JD, MPH - Webmaster
Provide Website Feedback - https://www.lsu.edu/feedback
Privacy Statement - https://www.lsu.edu/privacy
Accessibility Statement - https://www.lsu.edu/accessibility